
-
Wide Version Grow Light
Wide Version Grow Light
-
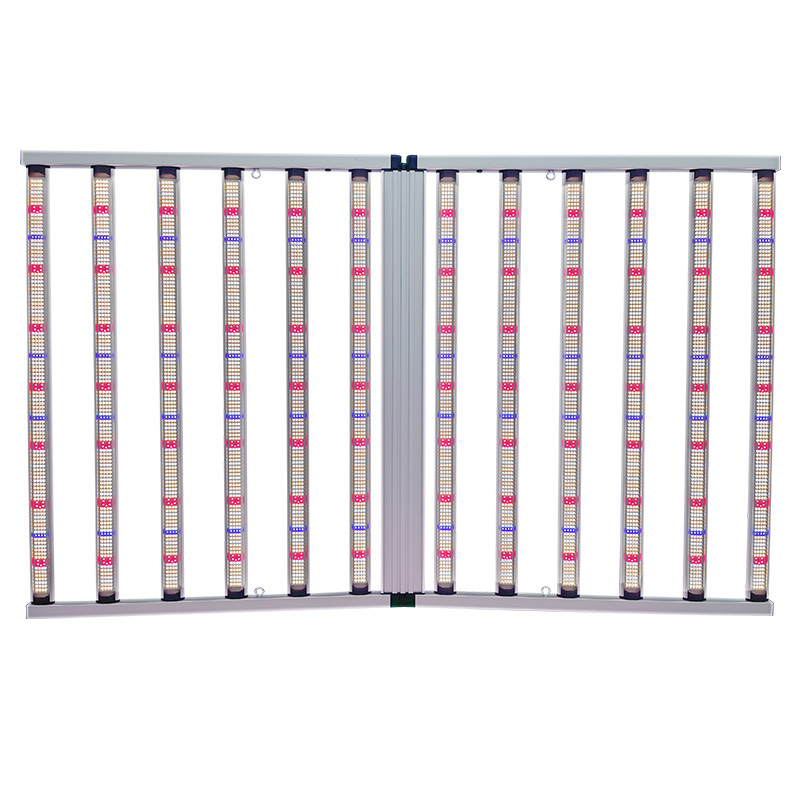
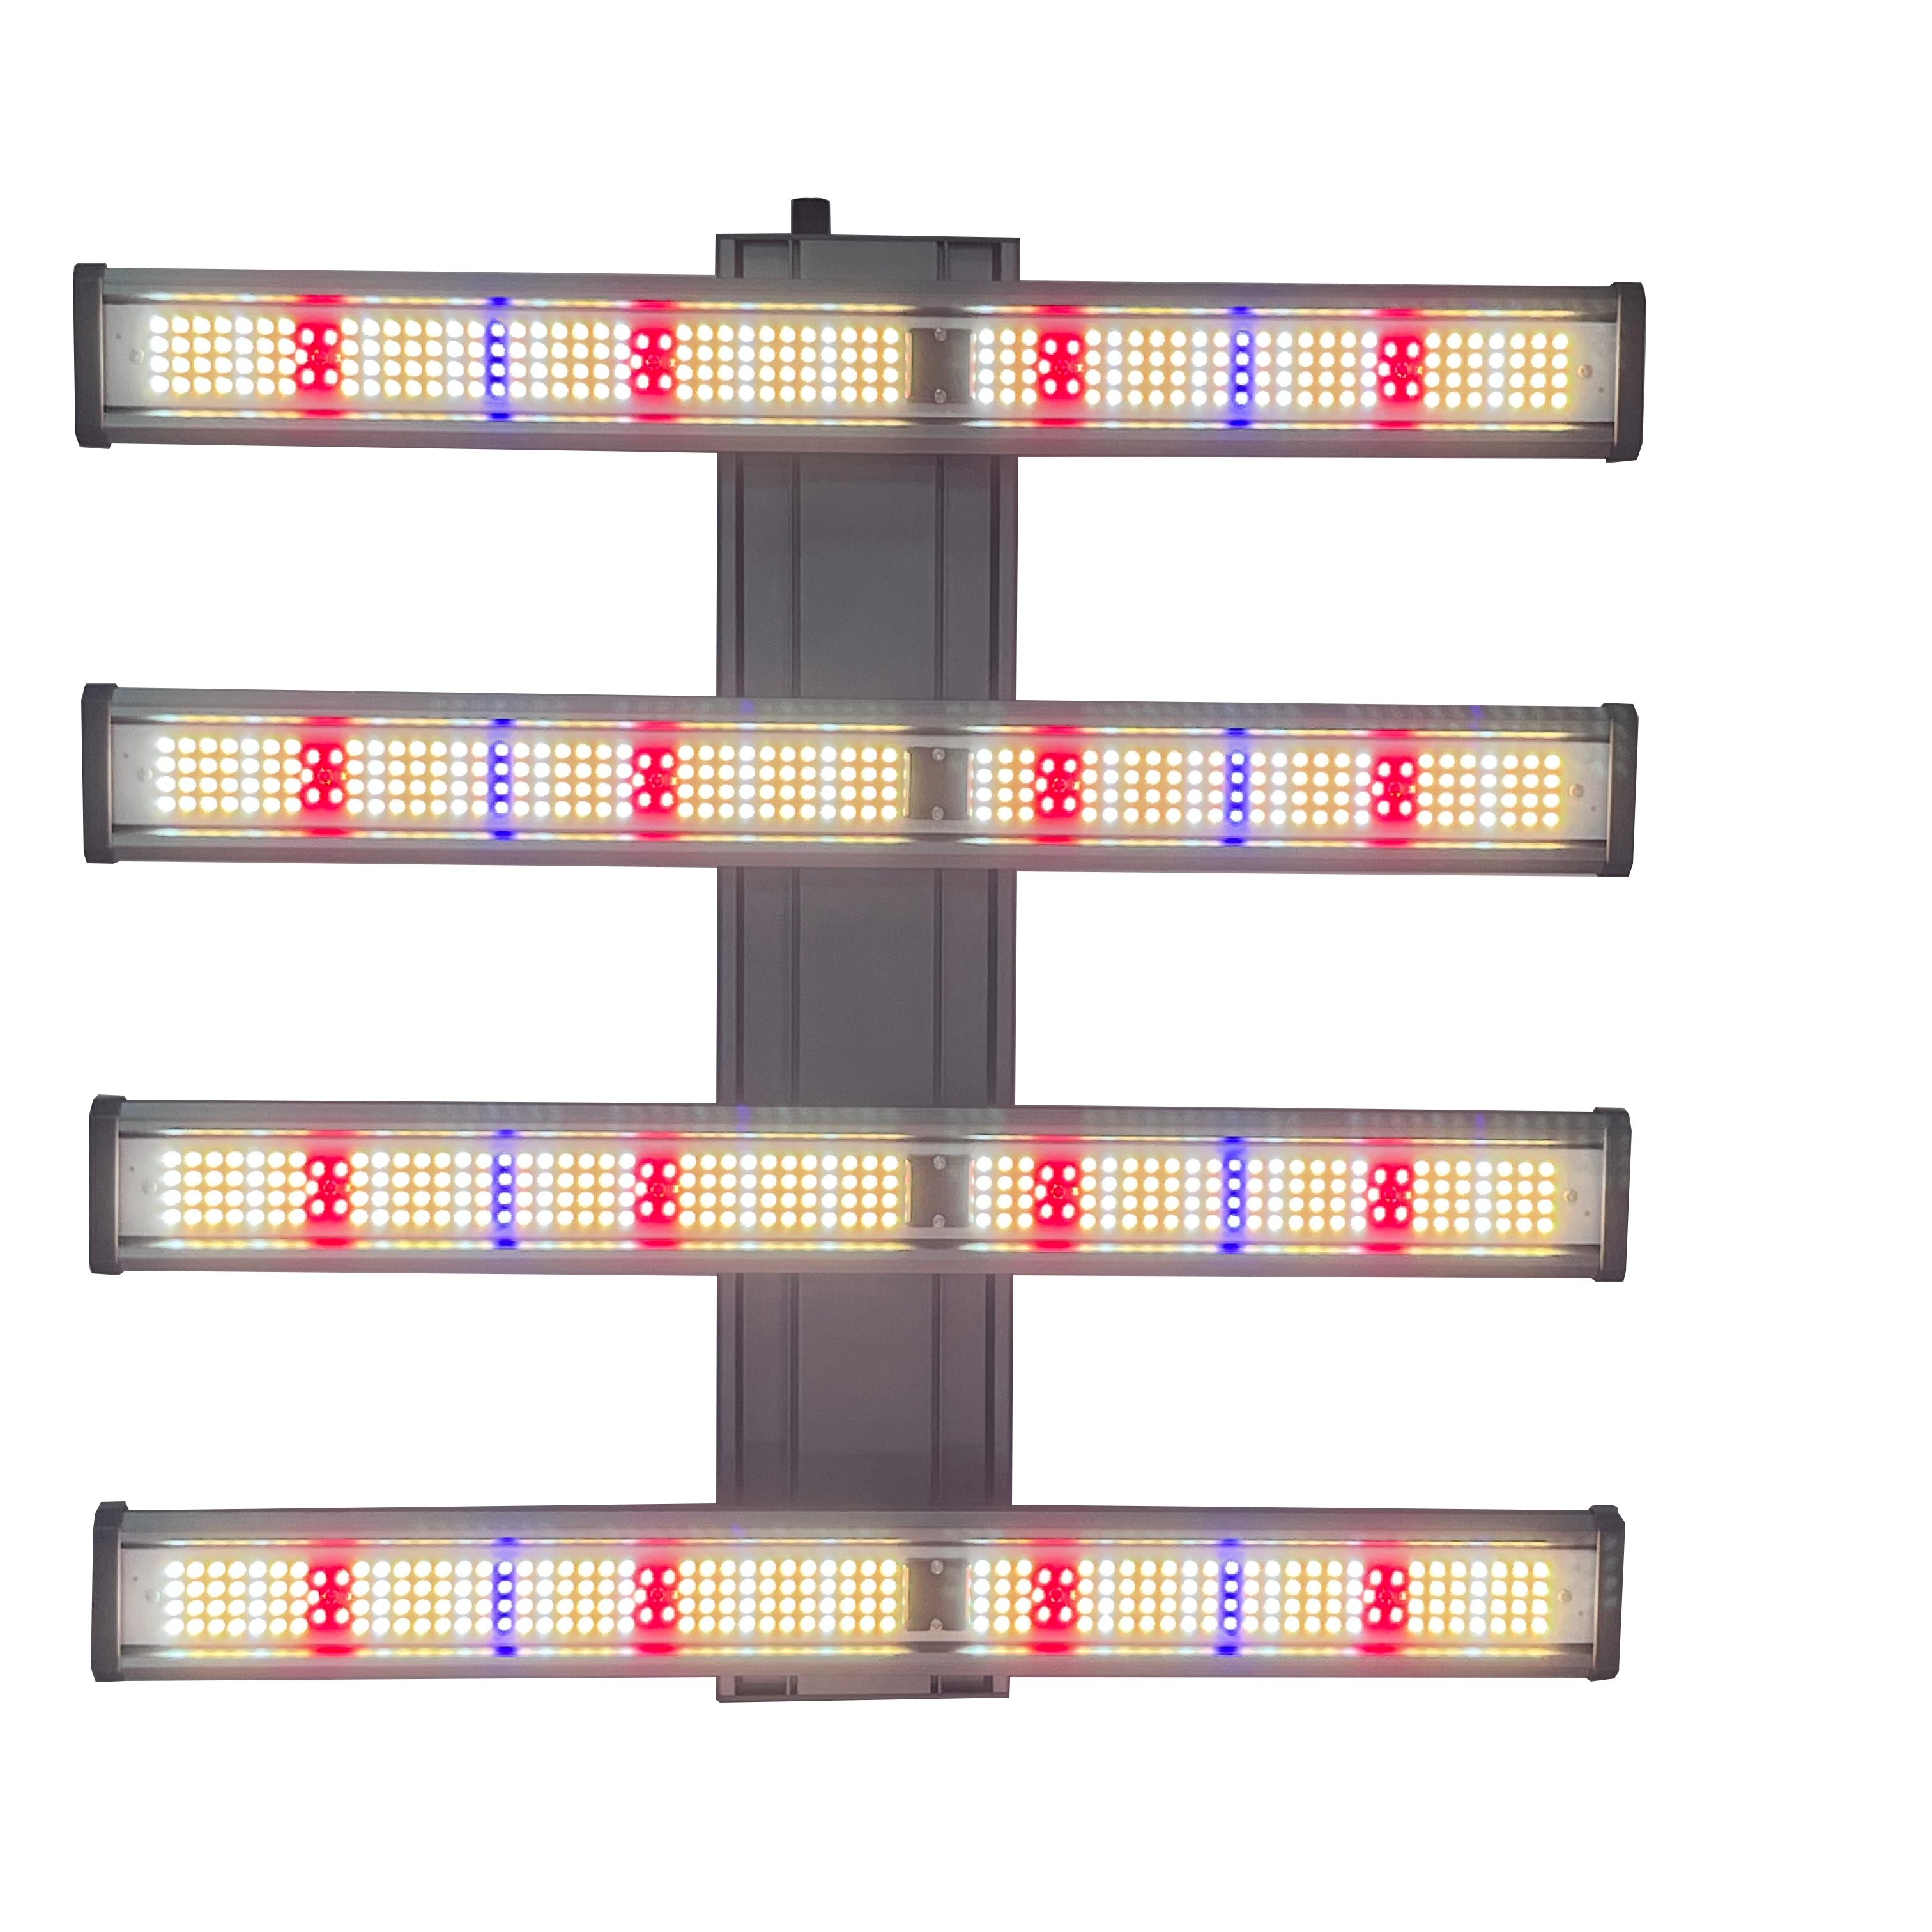
1500W 4x6ft Wide Full Spectrum UV LED Grow Lights-AD62-1500-3AQ3-180
 1500W 4x6ft Wide Full Spectrum UV LED Grow Lights-AD62-1500-3AQ3-180
• Light Intensity: 4500μmol/S PPF, 35% energy saving.
• Efficiency: High performance 3.0 μmol/J.
• Design: 180° foldable, space-saving and easy to install.
• Dimming: Rotary dimmer and daisy chain function for personalized light control.
• Dual Channel: Full spectrum + UV, suitable for all growth stages.
• Durability: IP65 waterproof rating, up to 50,000 hours of service life.Due to the differences in the growth laws of different plants, the light band and light color ratio required by each plant are not exactly the same. Generally, they need to be customized according to their own planting plants and communication with the manufacturer.
-
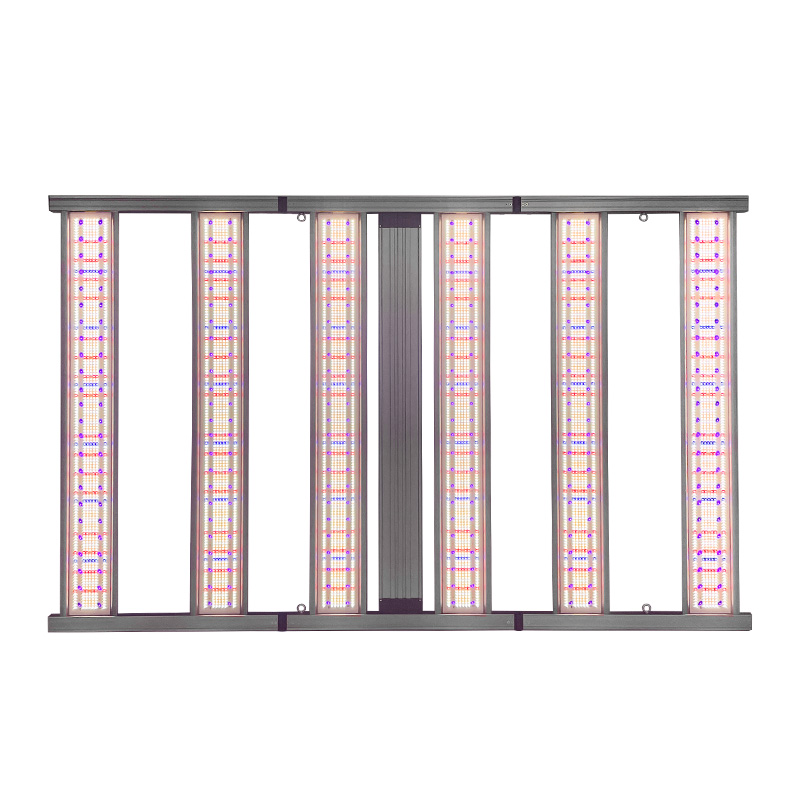
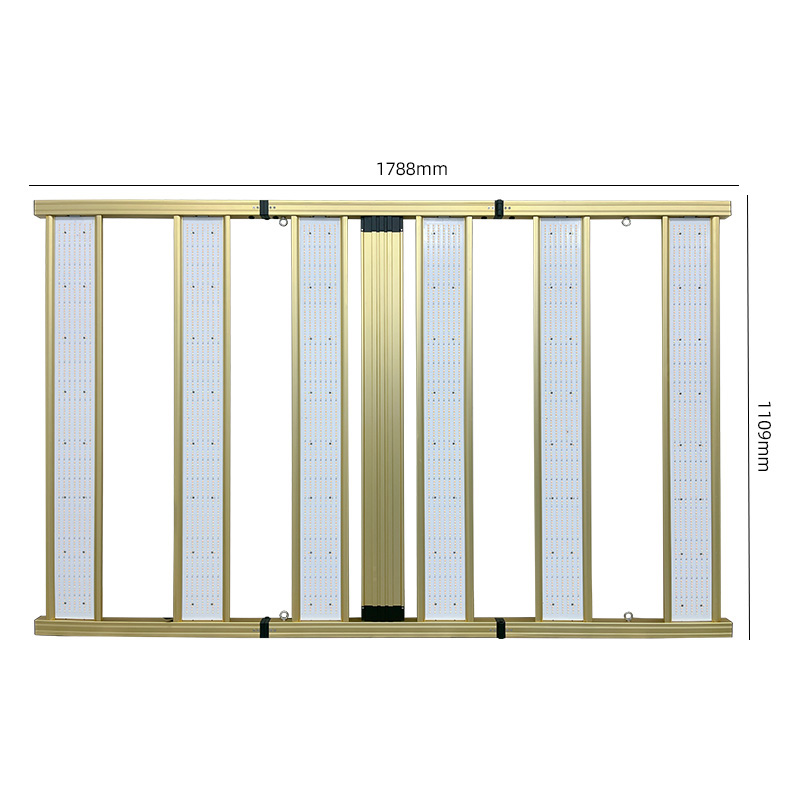
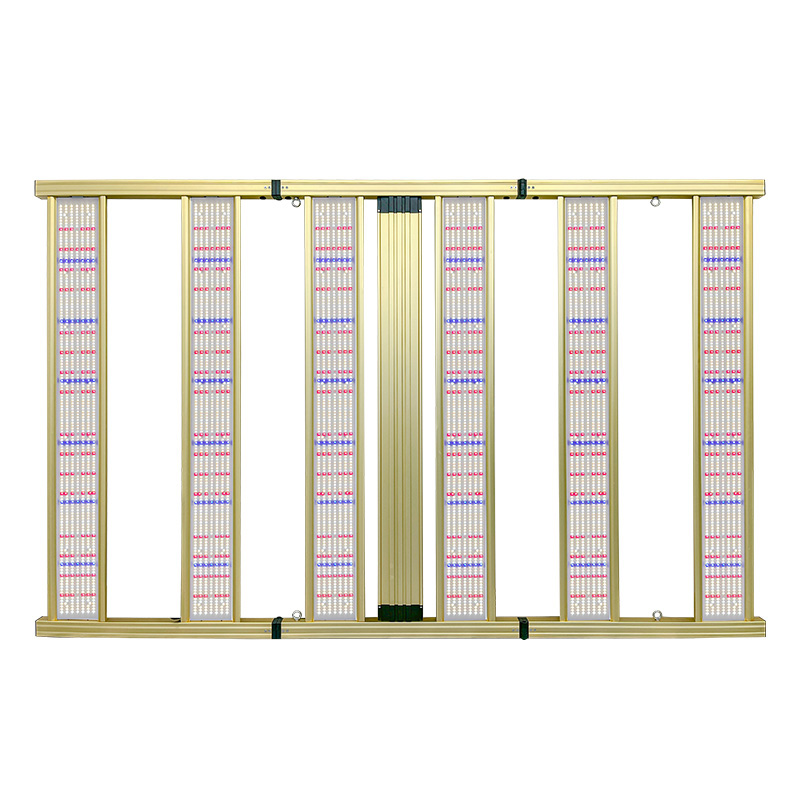
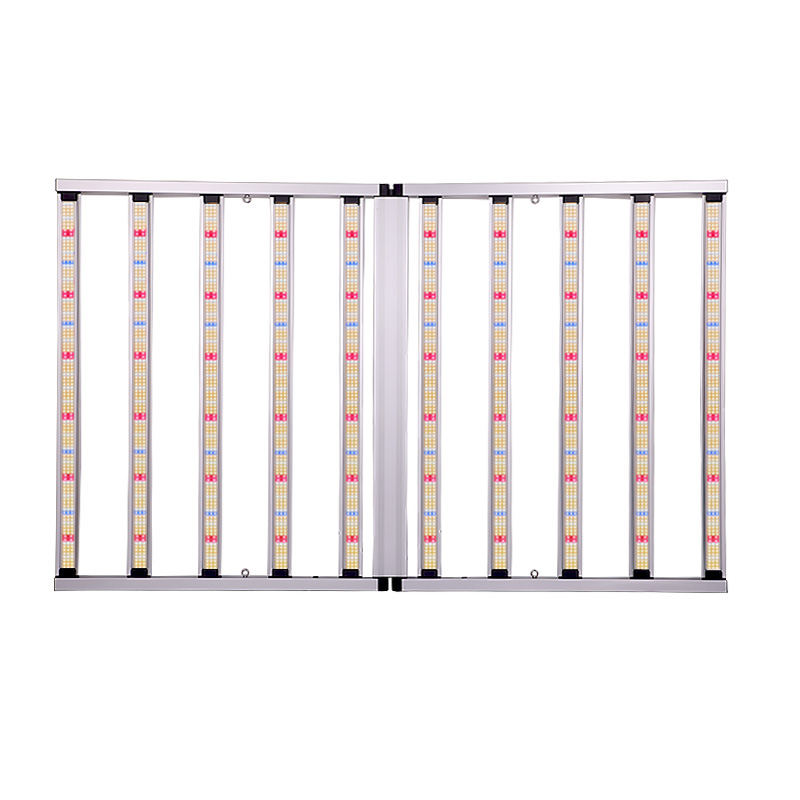
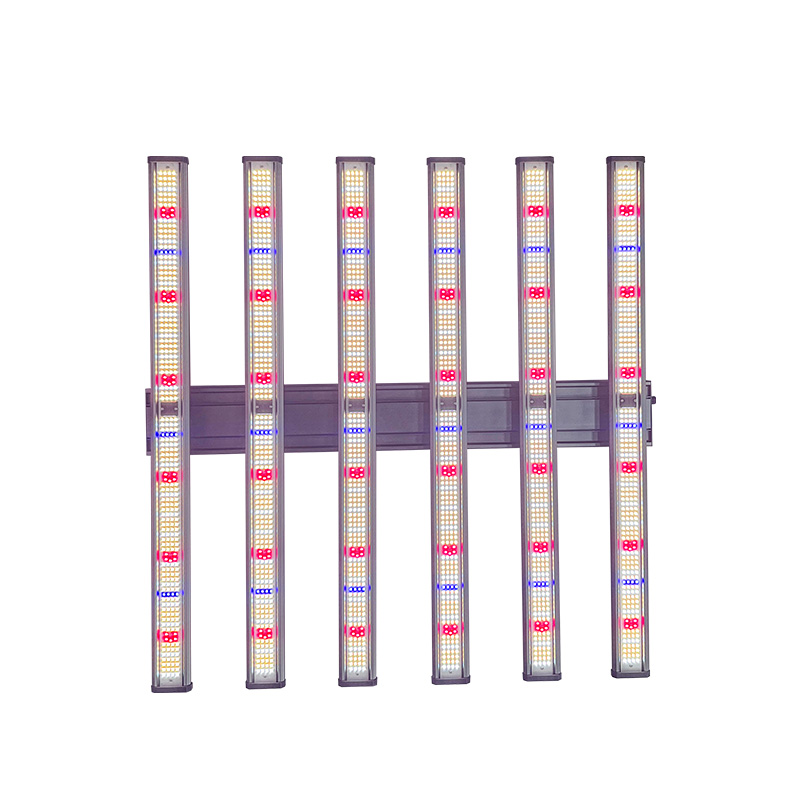
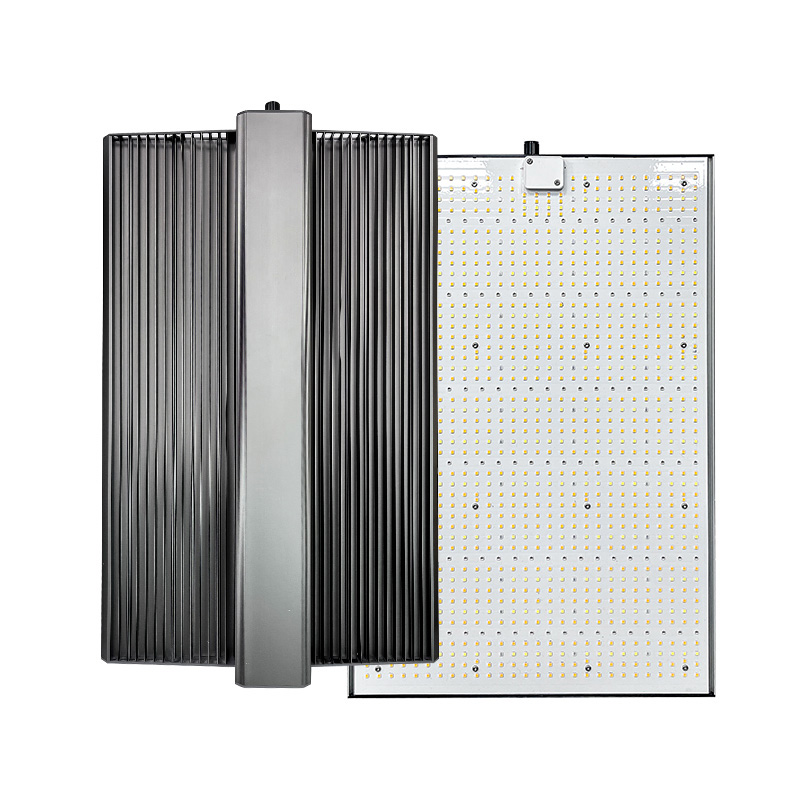
1500W 6 Bar 4x6ft Wide Full Spectrum LED Plant Grow Lights-AD6-1500-3AI3-180
1500W 6 Bar 4x6ft Wide Full Spectrum LED Plant Grow Lights-AD6-1500-3AI3-180
• Light Intensity: 4500μmol/S PPF, 35% energy saving.
• Efficiency: High performance 3.0 μmol/J.
• Design: 180° foldable, space-saving and easy to install.
• Dimming: Rotary dimmer and daisy chain function for personalized light control.
• Full spectrum:Suitable for all growth stages.
• Durability: IP65 waterproof rating, up to 50,000 hours of service life.The wide version full spectrum 1500 watt LED plant grow light helps to shorten the growth cycle of plants, can promote plants to produce more lateral branches and bud differentiation during the growth process, accelerate the growth of roots, stems and leaves.
-
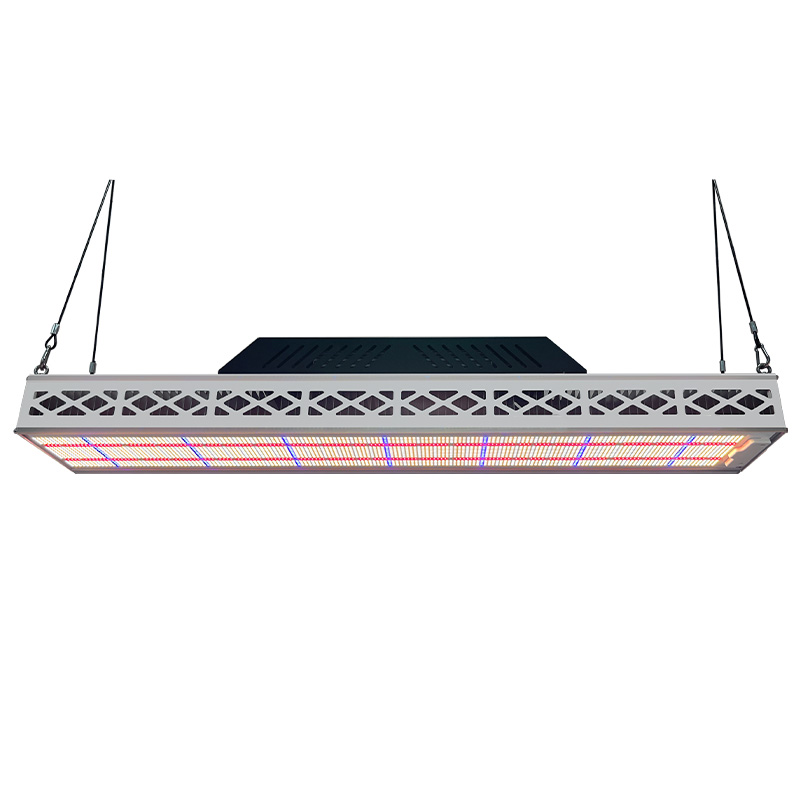
1200W 6 Bar 4x6ft Wide Full Spectrum LED Grow Lights-AD6-1200-3AI3-180
1200W 6 Bar 4x6ft Wide Full Spectrum LED Grow Lights-AD6-1200-3AI3-180
High efficiency: PPF up to 3600μmol/S, EFF up to 2.8-3.0μmol/J, reduce energy costs.
Bar style design: 6 wide strips, up to 1200W power.
Full spectrum lighting: Promote healthier and stronger plant growth.
Low heat emission: Reduce the risk of heat stress and prevent plant damage.
Easy to install: LED grow lights are low maintenance, saving you time and energy.
Optimized light output: The spectrum can be adjusted according to different plant types and growth stages.
Continuous output: Designed for continuous performance, ensuring optimal light output for a long time.
1200W Grow Light can also customize the light ratio suitable for different plants and different growth stages, solve the problem of lack of sunshine in the greenhouse in winter, promote the chlorophyll required in plant photosynthesis, improve the sweetness of fruits and reduce the occurrence of diseases and pests.
-
1500W 4x6ft Wide Full Spectrum UV LED Grow Lights-AD62-1500-3AQ3-180
-
Under Canopy Light
Under Canopy Light
-
150W 4FT Dual Channles Under Canopy LED Grow Light
150W 4FT Dual Channles Under Canopy LED Grow LightKey Features of Under Canopy Grow LightsVersatility and Durability;Lightweight and compact for easy installation;Daisy-chaining capabilities for seamless setups;Compatible with most RJ14-based controllers;Integrated driver and IP65 rating ensure reliability in commercial cultivation settings;Backed by a 5-year warranty and eligible for energy rebates (DLC and ETL certified).
-
100W UV IR 4ft Under Canopy Supplement LED Light Bar
100W UV IR 4ft Under Canopy Supplement LED Light Bar
QUICK INSTALLATION: The light bar can be easily secured into place, simplifying installation and ensuring optimal lighting angles and performance.
Compatible with all 4FT wide fixtures with independent dimming control.Why choose our Supply Series Auxiliary Light Bar?
In some primary light sources, a couple of 365 UV diodes and 730nm IR diodes may just be a marketing gimmick, and in reality they may not be strong enough. The Supply Series of auxiliary light sources has the densest diodes of any of our auxiliary light sources, specifically designed to promote plant growth.Why use 730nm infrared supplemental light bars?
Promotes stem growth, induces flowering, and light induces sleep.Why use 395nm UV supplemental light bars?
Increases yield, improves nutrients, enhances taste/flavor, sterilizes growing area (eliminates mold), helps control pests. -
120W 4FT Deep Red Spectrum Under Canopy Light
120W 4FT Deep Red Spectrum Under Canopy Light
Under Canopy LED Maximize Flowering and THC Concentration
Deep penetration of the 730nm spectrum: IR730nm LED strips penetrate deeper into plant tissue than visible light. This deep penetration stimulates stem growth and flowering.
Regulates plant growth: IR-assisted grow lights allow plants to move faster from the asexual growth stage to the flowering stage, shortening the entire growth cycle of the plant.
Daisy Chain: The strip light source allows for the simultaneous connection of up to 20 grow strips, making it especially convenient for commercial and large-scale growing operations. The plug-and-play feature ensures easy installation and operation, eliminating unnecessary hassles.
Increase photosynthetic efficiency: The deep red light of the grow strips creates a light-shielding effect that promotes stem growth.
Maximize Crop Yield: The addition of auxiliary lights is essential to optimize plant growth. -
120W 4FT Full Spectrum Under Canopy LED Grow Light
120W 4FT Full Spectrum Under Canopy LED Grow Light
Illuminating neglected areas:These advanced light sources penetrate deep into plant canopies to energize low-sprouting areas, cultivating a symphony of uniform, thriving growth from top to bottom.
Harvest Excellence:Experience an unprecedented surge in yield and harvest quality. These under-canopy lights achieve the perfect harmony of spectrum, intensity and coverage, ensuring that every bud gets the light it deserves.
Durable:Built to withstand the rigors of commercial marijuana cultivation, the fixtures are designed to last. With reliability at their core, these fixtures maintain consistent performance after harvest.
Maximize your harvest potential with LED Grow Light Warehouse’s line of under canopy LED grow lights. These specialized under canopy grow lights are designed to provide targeted lighting to the lower portion of your plants, ensuring even light distribution from top to bottom for healthier growth. Perfect for any setup, our under-canopy LED lights promote photosynthesis, increase yields and enhance overall plant performance.
-
150W 4FT Dual Channles Under Canopy LED Grow Light
-
One Channel Grow Light
One Channel Grow Light
-
1500W 6 Bar 4x6ft Wide Full Spectrum LED Plant Grow Lights-AD6-1500-3AI3-180
1500W 6 Bar 4x6ft Wide Full Spectrum LED Plant Grow Lights-AD6-1500-3AI3-180
• Light Intensity: 4500μmol/S PPF, 35% energy saving.
• Efficiency: High performance 3.0 μmol/J.
• Design: 180° foldable, space-saving and easy to install.
• Dimming: Rotary dimmer and daisy chain function for personalized light control.
• Full spectrum:Suitable for all growth stages.
• Durability: IP65 waterproof rating, up to 50,000 hours of service life.The wide version full spectrum 1500 watt LED plant grow light helps to shorten the growth cycle of plants, can promote plants to produce more lateral branches and bud differentiation during the growth process, accelerate the growth of roots, stems and leaves.
-
1200W 6 Bar 4x6ft Wide Full Spectrum LED Grow Lights-AD6-1200-3AI3-180
1200W 6 Bar 4x6ft Wide Full Spectrum LED Grow Lights-AD6-1200-3AI3-180
High efficiency: PPF up to 3600μmol/S, EFF up to 2.8-3.0μmol/J, reduce energy costs.
Bar style design: 6 wide strips, up to 1200W power.
Full spectrum lighting: Promote healthier and stronger plant growth.
Low heat emission: Reduce the risk of heat stress and prevent plant damage.
Easy to install: LED grow lights are low maintenance, saving you time and energy.
Optimized light output: The spectrum can be adjusted according to different plant types and growth stages.
Continuous output: Designed for continuous performance, ensuring optimal light output for a long time.
1200W Grow Light can also customize the light ratio suitable for different plants and different growth stages, solve the problem of lack of sunshine in the greenhouse in winter, promote the chlorophyll required in plant photosynthesis, improve the sweetness of fruits and reduce the occurrence of diseases and pests.
-
1500W 4x8ft LED Grow Light-AD15-1500-3C2-240
1500W 4x8ft LED Grow Light-AD15-1500-3C2-240
Helping to increase production and efficiency of large-scale cultivation
High-efficiency Light Energy Output: 1500W high-power design, PPE up to 4500μmol/s, light efficiency up to 2.8-3.0μmol/J, providing sufficient and uniform photosynthetic energy for plant growth.
Full Spectrum Coverage: Integrated white light + 660nm (deep red) + 730nm (far red) + 460nm (blue), accurately matching the needs of plants at all stages of growth, suitable for the whole process from seedling to fruiting.
Long-lasting & Durable: Adopting high-end brand lamp beads and high-quality aluminum heat sink, effectively reducing light decay, with a service life of up to 50,000 hours, reducing maintenance costs.
Professional Commercial Design: 4×8ft large size lamp body, suitable for greenhouse or vertical farms and other large-scale planting scenarios, to meet the demand for high-density fill light.
Intelligent Spectrum Adaptation: Multi-band combinations can be flexibly adjusted to provide differentiated spectral solutions for different crops (e.g. leafy vegetables, flowers, fruits and vegetables), helping to increase production and efficiency.
Certifications: DLC , ETL, CE, FCC, ROHS, UL, PSE for industry-leading quality and safety.
5-Year Warranty: Enjoy long-term reliability with a 5-year warranty.
-
1200W LED Grow Light AD12-1200-2C2-180 for Commercial Indoor Farming and Greenhouse Cultivation
1200W LED Grow Light AD12-1200-2C2-180 for Commercial Indoor Farming and Greenhouse Cultivation
Overview
The ANDY1200 LED grow light is designed for large-scale indoor farming and greenhouse cultivation systems, delivering high energy efficiency and uniform light distribution for commercial plant growth environments.
It provides stable full spectrum lighting with optimized power output, supporting different plant growth stages from vegetative to flowering.
Ideal for large growing areas, high energy efficiency and uniform light distribution
Brand diodes are long-lasting and can withstand high temperatures and usage conditions, making them a durable choice. Provides excellent light output per watt, resulting in lower power consumption and higher energy efficiency. Designed to provide high PAR values to promote plant growth and increase yields.
Efficient and productive: The bar design ensures even light distribution throughout the growing area, promoting steady growth and reducing the risk of uneven growth or shadowing.The ANDY1200 LED grow light delivers 1200 watts of power with a PPE of 3.0 μmol/J.
Optimized Light Spectrum: Full spectrum light, close to natural light, including wavelengths essential for photosynthesis. This spectrum can be adjusted according to different stages of plant growth (from growing to flowering), thus promoting healthier and more productive plants.
EFFICIENT COOLING: The bar light design and aluminum backside help improve airflow and heat dissipation. Reduces the risk of heat damage to plants and keeps the light closer to the canopy without causing burns. With a waterproof circuit board, there is no need to worry about wet conditions. Easy to install.
Daisy Chain Dimming: The dimming knob is perfect for growers to adjust the light intensity according to different growth stages. The daisy chain feature allows you to connect up to 50xANDY1200 indoor plant lighting.
Certifications: DLC , ETL, CE, FCC, ROHS, UL, PSE for industry-leading quality and safety.
5-Year Warranty: Enjoy long-term reliability with a 5-year warranty.
-
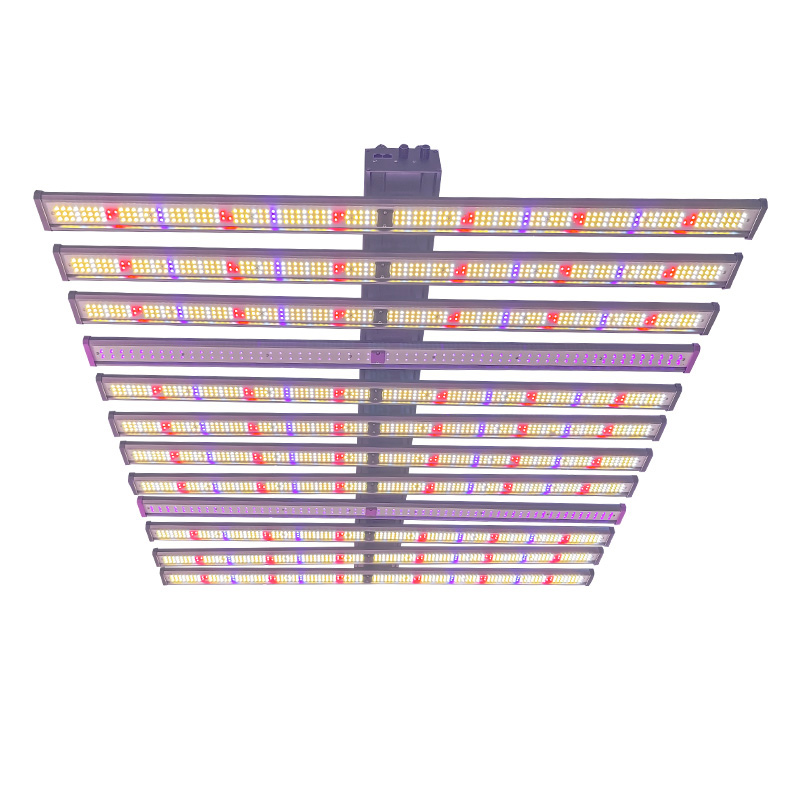
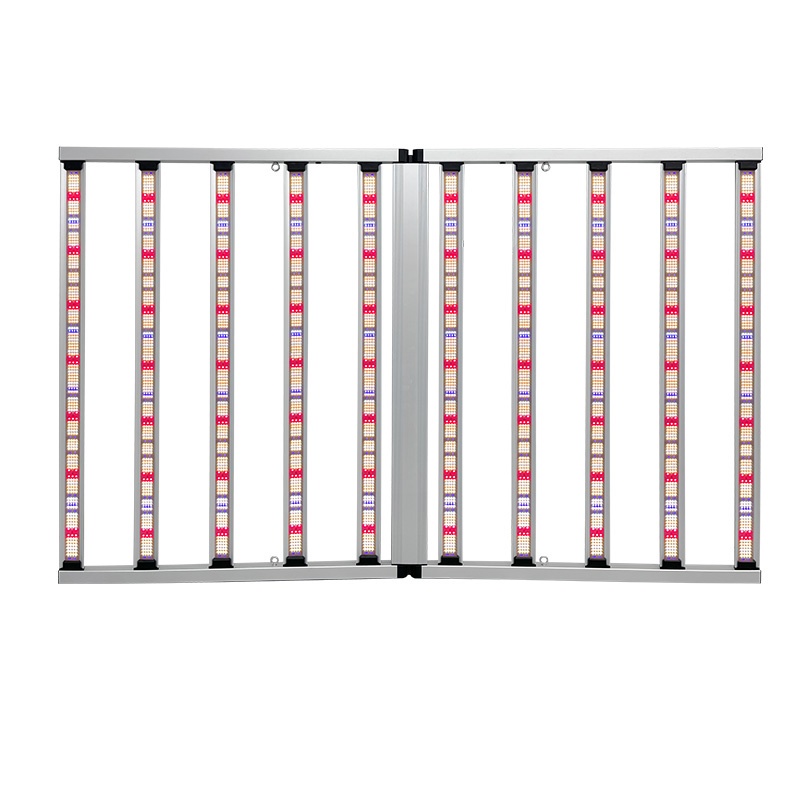
1000W 4x6ft LED Grow Light-AD10-1000-2C2-180
1000W 4x6ft LED Grow Light-AD10-1000-2C2-180
Cultivation on large commercial farms significantly improves the efficiency of cultivation.
True 1000W Power for Commercial-Scale Growing. Delivering a massive 3000μmol/s PPF across a 4x6ft area, this high-output 1000W LED grow light is built for serious growers who demand uniform coverage, deeper canopy penetration, and explosive plant development from seedling to harvest.
Full Spectrum design – All Growth Stages Covered. With a balanced light mix of 3000K, 6500K, 460nm blue, 660nm red, and 730nm IR, this fixture promotes vigorous veg growth and maximizes flowering potential—eliminating the need for separate lights for different stages.
Uniformity, Efficiency, and Heat. The 10-bar foldable design ensures consistent PPFD across every corner of the grow area, while its 2.8μmol/J efficiency keeps operating costs low. The aluminum heat sink design enables silent, passive cooling—no noisy fans or overheating worries.
Smart Group Control & Precision Dimming (0–100%). Integrated RJ45 daisy-chain ports allow synchronized multi-light setups—ideal for commercial growers scaling up. Fine-tune light output with the onboard dimmer to match each phase of plant growth and reduce electricity waste.
Built to Last. Premium Components & Long-Term Reliability. Constructed with high-quality LED chips and aluminum boards, this grow light resists light decay, offers stable output, and ensures years of reliable performance—making it a dependable investment for any indoor grower.
Certifications: DLC , ETL, CE, FCC, ROHS, UL, PSE for industry-leading quality and safety.
5-Year Warranty: Enjoy long-term reliability with a 5-year warranty.
-
1500W 6 Bar 4x6ft Wide Full Spectrum LED Plant Grow Lights-AD6-1500-3AI3-180
-
Dual Channel Grow Light
Dual Channel Grow Light
-
1060W+UV 4x4ft LED Grow Lights-AD122-1060W-D9(D10)-110
1060W+UV 4x4ft LED Grow Lights-AD122-1060W-D9(D10)-110
High efficiency: PPF up to 3180μmol/S, EFF up to 3.0μmol/J, reduce energy costs.
Full spectrum lighting: Promote healthier and stronger plant growth.
Detachable bar design: 12 bars, up to 1060W power.
Dual-channel spectrum: Full spectrum white light+UV395nm
Low heat emission: Reduce the risk of heat stress and prevent plant damage.
Easy to install: LED grow lights are low maintenance, saving you time and energy.
Optimized light output: The spectrum can be adjusted according to different plant types and growth stages.
Programmable power and spectrum catering to specificgrowing stages, growers benefit from:lmproved THC value,Increased flower volume,Smaller electricity bill.
-
1500W 4x6ft Wide Full Spectrum UV LED Grow Lights-AD62-1500-3AQ3-180
1500W 4x6ft Wide Full Spectrum UV LED Grow Lights-AD62-1500-3AQ3-180
• Light Intensity: 4500μmol/S PPF, 35% energy saving.
• Efficiency: High performance 3.0 μmol/J.
• Design: 180° foldable, space-saving and easy to install.
• Dimming: Rotary dimmer and daisy chain function for personalized light control.
• Dual Channel: Full spectrum + UV, suitable for all growth stages.
• Durability: IP65 waterproof rating, up to 50,000 hours of service life.Due to the differences in the growth laws of different plants, the light band and light color ratio required by each plant are not exactly the same. Generally, they need to be customized according to their own planting plants and communication with the manufacturer.
-
1100W+UV 4×6ft LED Grow Light-AD102-1100-2U2-180
1100W+UV 4×6ft LED Grow Light-AD102-1100-2U2-180
High luminous efficacy and controllable spectrum to meet the needs of large-scale cultivation
Energy saving and high efficiency: 1100W power equipped with high-end lamp beads, PPE up to 3300μmol/s, luminous efficacy of 2.8-3.0μmol/J, realizing the perfect combination of ultra-high photosynthetic efficiency and energy efficiency.
Intelligent adjustable spectrum: covering white light + 660nm (deep red) + 730nm (far red) + 460nm (blue) + 395nm (UV), dual-channel independent dimming (full-spectrum + UV), and UV mode optimized for later color and flavor enhancement.
Industrial-grade durable design: aluminum plate efficient heat dissipation structure, high temperature resistance, corrosion resistance, significantly reduce light decay, to ensure long-term stable operation and prolong the service life.
Large Scene Adaptability: 4×6ft large size light area, suitable for vertical farms, greenhouses and other commercial planting scenarios to meet the demand for high-density planting.
Full-cycle coverage: full support from seedling to flowering and fruiting, adapting to the growth needs of various types of crops and helping to improve both yield and quality. -
1600W+UV 4×8ft LED Grow Light-AD152-1600W-3S2-240
1600W+UV 4×8ft LED Grow Light-AD152-1600W-3S2-240Helping to increase production and efficiency of large-scale cultivationHigh-efficiency light energy output: 1600W high-power design, PPE up to 4800μmol/S, light efficiency up to 2.8-3.0μmol/J, providing sufficient and uniform photosynthetic energy for plant growth.Full Spectrum Coverage: Integrated white light + 660nm (deep red) + 730nm (far red) + 460nm (blue)+395nm(UV), accurately matching the needs of plants at all stages of growth, suitable for the whole process from seedling to fruiting.Long-lasting and durable: Adopting high-end brand lamp beads and high-quality aluminum heat sink, effectively reducing light decay, with a service life of up to 50,000 hours, reducing maintenance costs.Professional commercial design: 4×8ft large size lamp body, suitable for greenhouse or vertical farms and other large-scale planting scenarios, to meet the demand for high-density fill light.Intelligent Spectrum Adaptation: Multi-band combinations can be flexibly adjusted to provide differentiated spectral solutions for different crops (e.g. leafy vegetables, flowers, fruits and vegetables), helping to increase production and efficiency.
-
1300W+UV 4×6 feet LED growth light-AD122-1300-2U2-180
1300W+UV 4×6 feet LED growth light-AD122-1300-2U2-180High light efficiency and controllable spectrum to meet the needs of large-scale plantingEnergy saving and efficient: Equipped with high-end LED beads with a power of 1300W, PPE up to 3900 μ mol/s, and luminous efficiency up to 3.0 μ mol/J, achieving a perfect combination of ultra-high photosynthetic efficiency and energy efficiency.Intelligent adjustable spectrum: covering white light+660nm (deep red)+730nm (far red)+460nm (blue)+395nm (ultraviolet), dual channel independent dimming (full spectrum+ultraviolet) UV mode optimization can enhance post production color and flavor.Industrial grade durable design: Aluminum plate high-efficiency heat dissipation structure, high temperature resistance, corrosion resistance, significantly reduces light decay, ensures long-term stable operation, and extends service life.Adaptability to Large Scenarios: A 4 × 6 foot large illuminated area, suitable for commercial planting scenarios such as vertical farms and greenhouses, meeting high-density planting needs.Full cycle coverage: providing comprehensive support from seedlings to flowering and fruiting, adapting to the growth needs of various crops, and helping to improve yield and quality.
-
1060W+UV 4x4ft LED Grow Lights-AD122-1060W-D9(D10)-110
-
Three Channel Grow Light
Three Channel Grow Light
-
1000W+UV+IR 4x4ft LED Plant Grow Light-AD103-1000-D15-110
1000W+UV+IR 4x4ft LED Plant Grow Light-AD103-1000-D15-110
High efficiency: PPF up to 3000μmol/S, EFF up to 3.0μmol/J, reduce energy costs.
Full spectrum lighting: Promote healthier and stronger plant growth.
Detachable bar design: 10 bars, up to 1000W power.
Three-channel dimming: Full spectrum white light+UV395nm+IR730nm
Low heat emission: Reduce the risk of heat stress and prevent plant damage.
Easy to install: LED grow lights are low maintenance, saving you time and energy.
Optimized light output: The spectrum can be adjusted according to different plant types and growth stages.
Programmable power and spectrum catering to specificgrowing stages, growers benefit from:lmproved THC value,Increased flower volume,Smaller electricity bill.
-
450W+UV+IR 4x2ft Grow Light-AD43-450-2Y2-053
450W+UV+IR 4x2ft Grow Light-AD43-450-2Y2-053
Three-channel independent dimming, low cost and high output.
Energy efficient design: 450W power with high-end lamp beads, PPE up to 1260μmol/s, luminous efficacy of 2.8μmol/J, lumen value of 72000LM, to achieve a balance between high photosynthetic efficiency and low energy consumption.
Full-spectrum intelligent regulation: covering white light + 660nm (deep red) + 730nm (far red) + 460nm (blue) + 395nm (UV), three-channel independent dimming (full-spectrum/UV/IR), accurately adapted to the needs of plants at various stages of growth.
Long-lasting and stable heat dissipation: High-quality aluminum plate heat dissipation structure significantly reduces light decay, extends service life, and guarantees long-term stable operation.
Convenient and easy to use: 4×2ft large size design, no need to install complex installation, saving labor and time costs.
Full-cycle applicability: Supporting the whole process from seedling to flowering and fruiting, it is suitable for commercial planting scenarios such as greenhouses and vertical farms, helping to increase crop yield and improve quality.
Certifications: DLC , ETL, CE, FCC, ROHS, UL, PSE for industry-leading quality and safety.
5-Year Warranty: Enjoy long-term reliability with a 5-year warranty.
-
1000W+UV+IR 4x4ft LED Plant Grow Light-AD103-1000-D15-110
-
Detachable Grow Light
Detachable Grow Light
-
1060W+UV 4x4ft LED Grow Lights-AD122-1060W-D9(D10)-110
1060W+UV 4x4ft LED Grow Lights-AD122-1060W-D9(D10)-110
High efficiency: PPF up to 3180μmol/S, EFF up to 3.0μmol/J, reduce energy costs.
Full spectrum lighting: Promote healthier and stronger plant growth.
Detachable bar design: 12 bars, up to 1060W power.
Dual-channel spectrum: Full spectrum white light+UV395nm
Low heat emission: Reduce the risk of heat stress and prevent plant damage.
Easy to install: LED grow lights are low maintenance, saving you time and energy.
Optimized light output: The spectrum can be adjusted according to different plant types and growth stages.
Programmable power and spectrum catering to specificgrowing stages, growers benefit from:lmproved THC value,Increased flower volume,Smaller electricity bill.
-
1000W+UV+IR 4x4ft LED Plant Grow Light-AD103-1000-D15-110
1000W+UV+IR 4x4ft LED Plant Grow Light-AD103-1000-D15-110
High efficiency: PPF up to 3000μmol/S, EFF up to 3.0μmol/J, reduce energy costs.
Full spectrum lighting: Promote healthier and stronger plant growth.
Detachable bar design: 10 bars, up to 1000W power.
Three-channel dimming: Full spectrum white light+UV395nm+IR730nm
Low heat emission: Reduce the risk of heat stress and prevent plant damage.
Easy to install: LED grow lights are low maintenance, saving you time and energy.
Optimized light output: The spectrum can be adjusted according to different plant types and growth stages.
Programmable power and spectrum catering to specificgrowing stages, growers benefit from:lmproved THC value,Increased flower volume,Smaller electricity bill.
-
500W 3x3ft Detachable LED Grow Light-AD6-500W-D30-084
500W 3x3ft Detachable LED Grow Light-AD6-500W-D30-084
Powerful 500W Full Spectrum Light for All Growth Stages
High PPFD: This grow light delivers a high PPF of 1400μmol/s and full-spectrum coverage (380–780nm), ideal for seedling, vegetative, and flowering stages. Whether you’re growing leafy greens or flowering plants, it provides the optimal light your plants need.
High Efficiency Samsung LEDs: Built with premium Samsung diodes, this grow light ensures high efficiency (2.8μmol/J), brighter output, lower energy consumption, and longer lifespan—helping you save on electricity while maximizing plant yields.
6-Bar Design with 3x3ft Size: Featuring a detachable 6-bar design, this grow light covers a 3×3 ft area perfectly. Easy to assemble, move, or replace individual bars—great for customized setups in grow tents or indoor grow rooms.
Daisy Chain & Dimming Function : Equipped with an RJ45 daisy-chain port and dimmer knob, you can link and control multiple lights simultaneously. Adjust the brightness from 0% to 100% to suit each plant’s specific needs and growth phase.
Premium Aluminum Build : The aluminum light bars act as efficient heat sinks, ensuring rapid heat dissipation, reducing light decay, and extending the lifespan of your grow light—no noisy fans required.
Certifications: DLC , ETL, CE, FCC, ROHS, UL, PSE for industry-leading quality and safety.
5-Year Warranty: Enjoy long-term reliability with a 5-year warranty.
-
240W 2x2ft Detachable LED Grow Light-AD4-240W-D31-054
240W 2x2ft Detachable LED Grow Light-AD4-240W-D31-054
Covering the full cycle of growth
Precise Spectrum:Innovative hybrid spectrum technology (3000K+6500K+460nm+660nm+730nm) simulates the natural sunlight, and is intelligently adapted from the seedling to the flowering stage. 460nm blue light promotes the growth of stems and leaves, 660nm deep red light accelerates the flowering and fruiting, and 730nm far-red light extends photoperiodic effect, laboratory-grade. Spectral ratios to maximize the photosynthetic efficiency of plants.
Energy-saving and long-lasting: Equipped with 240W high-power Samsung LM281B + flagship lamp beads, PPF value of 680 μmol / s, photosynthetically effective photon efficacy of 2.8 μmol / J ultra-industry standards. Aluminum substrate active heat dissipation structure to reduce the light decay rate of 67%, 30,000 hours of continuous high-intensity light brightness retention rate of > 90%, greenhouse-level durable quality.
Modular planting:Detachable 4-light bar design, single light covers 2x2ft planting area, up to 100 devices can be controlled in series through RJ45 port. With 0-100% infinitely dimmable knob, one key synchronized regulation of light intensity of multiple lights, to meet the needs of multiple scenarios from home nursery to commercial planting.
Zero-tool maintenance design: Light bar tool-free 3 seconds quick-disassembly replacement, support for single independent maintenance. Matching hanging installation program, convenient to adjust the height of the lamp at any time, from succulent to fruit trees are applicable.
Certifications: DLC , ETL, CE, FCC, ROHS, UL, PSE for industry-leading quality and safety.
5-Year Warranty: Enjoy long-term reliability with a 5-year warranty.
-
1060W+UV 4x4ft LED Grow Lights-AD122-1060W-D9(D10)-110
-
Quantum Board Grow Light
Quantum Board Grow Light
-
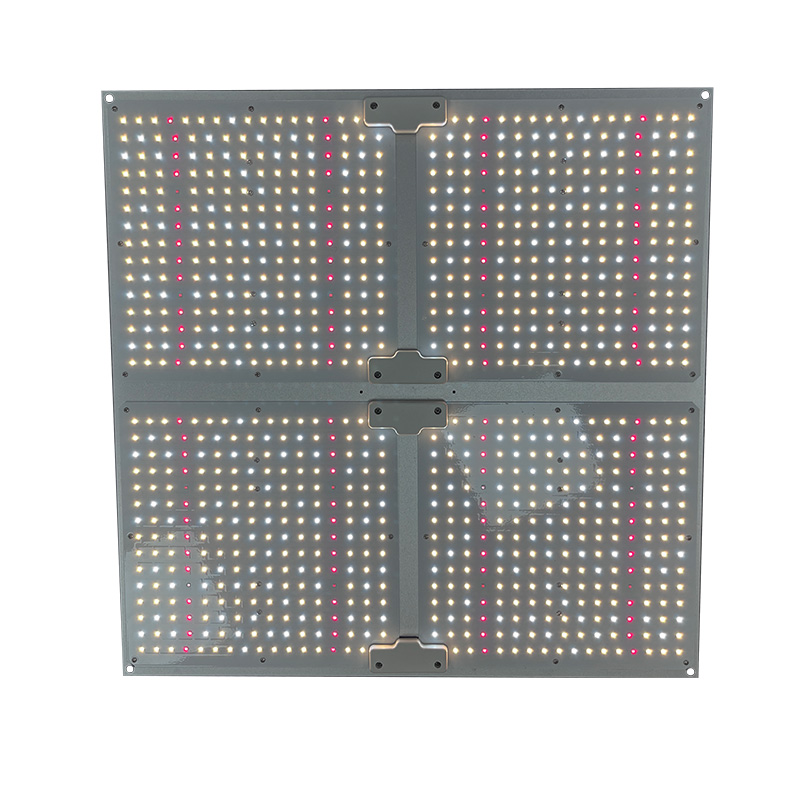
400W LED Grow Light Panels-AD4W-400-1D221
400W LED Grow Light Panels-AD4W-400-1D221
Greenhouse Veg Bloom Seedlings Hydroponics Grow Light Panel
Better light spectrum optimization: Full spectrum lights are all-around products that can provide adequate and balanced lighting for a plant throughout its life cycles. These lights covers the whole spectrum. They provide the flexibility you need to grow a variety of plants, for both veg and bloom stage.
Superior light output throughout the year: ANDY Grow Lights combine to provide the optimum level of light for both photosynthesis and growth that will allow your indoor garden to bloom and flourish year-round. They are perfect for small grows and can work with a wide range of plant species, include both low light and high light varieties.
Easy installation and usage: The upgraded suspension kit can be assembled easily without additional tools. The panels come with a 6 feet power cord, and simple plug and play usage. Easy to add a convenient indoor garden in any room of your home. Perfect for you to add as a supplemental side panel in the grow tent during bloom.
Low heat , low power,compact & space saving:Advanced LED technology, efficient replacement of HID. They run cooler than traditional light sources and operate efficiently. No damage to the plants even if they are very close. LED systems take much less room than HIDs, and are easier to move around and manage.
Certifications: DLC , ETL, CE, FCC, ROHS, UL, PSE for industry-leading quality and safety. -
400W LED Grow Light Panel-AD4W-400-1D221
400W LED Grow Light Panel-AD4W-400-1D221
Greenhouse Veg Bloom Seedlings Hydroponics Grow Light Panel
Beetter light spectrum optimization: Full spectrum lights are all-around products that can provide adequate and balanced lighting for a plant throughout its life cycles. These lights covers the whole spectrum, from UV, IR to red and blue lights. They provide the flexibility you need to grow a variety of plants, for both veg and bloom stage.
Superior light output throughout the year: ANDY Grow Lights combine to provide the optimum level of light for both photosynthesis and growth that will allow your indoor garden to bloom and flourish year-round. They are perfect for small grows and can work with a wide range of plant species, include both low light and high light varieties.
Easy installation and usage: The upgraded suspension kit can be assembled easily without additional tools. The panels come with a 6 feet power cord, and simple plug and play usage. Easy to add a convenient indoor garden in any room of your home. Perfect for you to add as a supplemental side panel in the grow tent during bloom.
Low heat , low power,compact & space saving:Advanced LED technology, efficient replacement of HID. They run cooler than traditional light sources and operate efficiently. No damage to the plants even if they are very close. LED systems take much less room than HIDs, and are easier to move around and manage.
Certifications: DLC , ETL, CE, FCC, ROHS, UL, PSE for industry-leading quality and safety.
5-Year Warranty: Enjoy long-term reliability with a 5-year warranty.
-
300W LED Quantum Board Grow Light-AD1-300-1D603(J3001)
300W LED Quantum Board Grow Light-AD1-300-1D603(J3001)
Maximize your grow potential with our advanced LED Quantum Board Grow Light
- DAISY CHAIN & DIMMABLE – AD1-300-1D603 plant light adds daisy chain function, achieving to connect multi grow lights (max 100pcs ) and control them at the same time, it’s very convenient for commercial growing. Flexible 0-100% dimmer knob available, it can help you freely adjust the brightness of the plant light, allowing flexibility to obtain perfect growth performance for each growing phase.
- LOWER COST & HIGH YIELDS – AD1-300-1D603 led plant growing lights use the newest high-yield SMD LED technology. Though the LED Growing Lights only consumes 300 watt of power, achieving higher average PPFD with 870 umol/s. It is also an ideal LED grow light from seeds to harvest. It will be a perfect option if you like to light a small space, add a little light to your current space, or use it for clones, seedlings, or bloom.
- OPTIMAL FULL SPECTRUM GROW LIGHT – AD1-300-1D603 small grow light led consists of full spectrum 3000K warm light, 6500K white light, 460nm blue light, 660nm red light, 730nm IR light, infinitely close to natural sun light. It is an excellent full spectrum for vegetating and flowering indoor plants. Wide Input Voltage 100-277V, can meet most input voltage.
- AMAZING HEAT DISSIPATION & WORKING QUIET – LED light board style and aluminum material can help quickly heat dissipation, reduce the light lost in walkways and walls, increase the light intensity, ensure longer lifetime and lower energy bill. With no fan design, the led grow light full spectrum can provide a quiet working environment without interruption.
- VALUE FOR MONEY– The led grow light 300w is ideal for greenhouses, grow tents, stand rack, vertical farming, etc.
- Certifications: DLC , ETL, CE, FCC, ROHS, UL, PSE for industry-leading quality and safety.
- 5-Year Warranty: Enjoy long-term reliability with a 5-year warranty.
-
400W LED Grow Light Panels-AD4W-400-1D221
-
Top-Fill Grow Light
Top-Fill Grow Light
-
640W Top Fill Full Spectrum LED Grow Lights-ADT1-640-D57
640W Top Fill Full Spectrum LED Grow Lights-ADT1-640-D57
»With Samsung LEDs,Brand Drivers, guaranteed service life, high PPFD;
»Full spectrum, suitable for all stages of plant growth;
»The installation height of the product is relatively high;
»Small shielding area from sunlight; Suitable for big greenhouse planting;
»Special optical design makes the irradiation of plants more uniform;
»Easy to disassemble, easy to transport, flexible installation.
»The Top Series LED Grow Light is mainly used for top light, such as modern greenhouses. Because the height of space is high enough, it is necessary to ensure that the light on the plants is more uniform. Light, this requires the size of light products to be compact and not folded to the sunlight. Because the hanging is high, it is necessary to ensure that the light emitting angle is small and ensure that the light is fully exposed to the plant.
-
640W Top Fill Full Spectrum LED Grow Lights-ADT1-640-D57
-
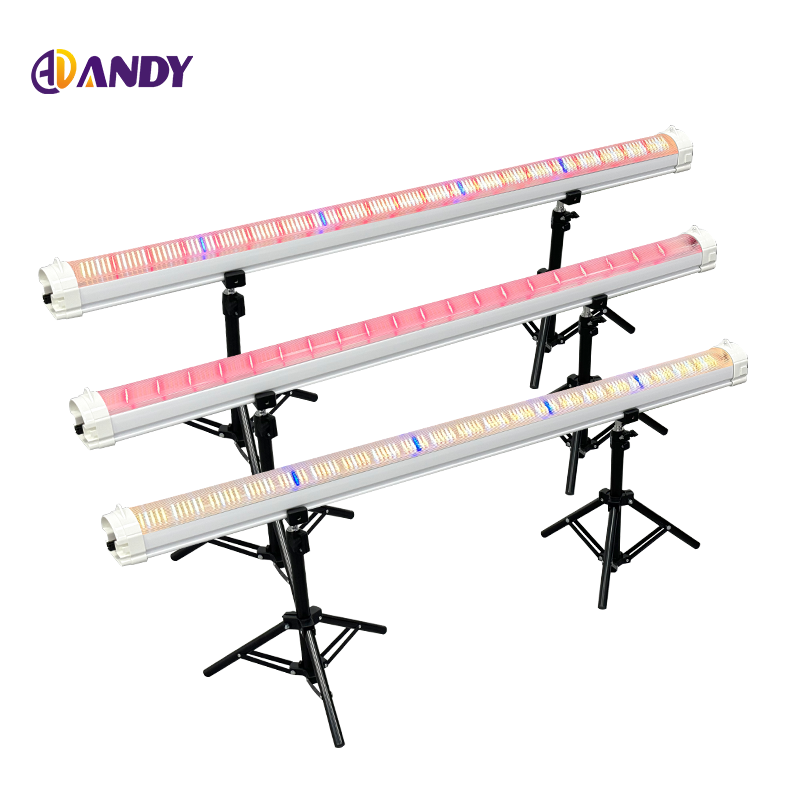
T8 Tube Light Bar
T8 Tube Light Bar
640nm vs 660nm Red Light: Which Is Better for Plant Growth
A 660 nm fixture can deliver weak PPFD at the crop’s edge. Could 640 nm fix it? The label leaves that unresolved. Request the spectral power distribution (SPD) and map canopy PPFD. Only then compare crop performance under matched conditions. Use a bay for 640 nm and 660 nm. Compare harvest yield across bays.
640nm vs 660nm Red Light: What Is the Practical Difference?
How a 20 nm Shift Changes Photon Energy and Absorption
The peaks sit 20 nm apart. Their positions alone cannot describe the actual red output reaching a crop canopy at planned operating height. Each diode emits a band. Leaf absorption depends on that band’s shape. The peak cannot answer a coverage question. The full SPD reveals other channels; canopy measurements show where their photons land. 660 nm photons carry less energy. The gap from 640 nm is slight.
Why a Wavelength Peak Does Not Predict Plant Growth on Its Own
Identical peak labels do not guarantee identical PPFD maps. Plants at the perimeter may receive unequal doses despite the shared peak label. Their PPFD maps reveal that difference; their peak labels do not. K. J. McCree’s 1971 crop-plant study examined photosynthesis action spectra, absorptance, and quantum yield under defined conditions. It offers a way to interpret wavelength response, while fixture selection still calls for crop results at the proposed intensity, temperature, and accompanying spectrum. For context, see this red-light guide.
Does 640nm or 660nm Drive Photosynthesis Better?
How to Read Photosynthesis Action Spectra Without Overgeneralizing
An action spectrum may be measured on one leaf. That leaf is only part of a production canopy. Lower leaves receive different light; crop response takes time. The endpoint must match the intended harvest outcome.
Trial reports need crop, photon dose, and endpoint before a photosynthesis result can guide harvest decisions. Did the treatments receive equal photons? Was the outcome leaf photosynthesis or marketable yield? One cannot establish the other. If evidence ends at leaf response, plan a crop trial before specifying a room.
Why PPFD and Delivered Photon Dose Matter Alongside Wavelength
Coverage matters because center PPFD does not stand in for outer rows. A grid at canopy height reveals differences at the hanging height and dimming setting. PPFD reports photosynthetic-range photons arriving per area each second. PAR names the range but offers no intensity value; the PPFD and PAR explainer defines those terms for specification readers.
Two bays can share an SPD yet receive different daily light integral (DLI) when hours differ. A crop response could follow that longer exposure rather than the red peak. Pair flowering and maturity PPFD with actual hours in each bay. Did temperature or irrigation shift between bays? Either can mimic a red-channel effect.

When Should Growers Choose 640nm, 660nm, or Both?
Match Red Light to the Crop, Canopy, and Growth Stage
The 1000 W 4 × 6 ft stage table is a fixture-setting reference, not evidence that one red peak wins. It lists changing mounting height, dimming, power, PPFD, and light-dark timing as plants develop. Start there, then measure the selected cultivar’s canopy at the planned density and layout. A low perimeter reading points first to a coverage issue; changing red channels would not fix that distribution.
Without crop stage, fixture height, dimming, and schedule, later canopy readings cannot be compared across stages.
When a Dual-Peak Red Spectrum Is Worth Considering
Two peaks show the red mix; neither proves better yields. Compare PPFD across both crop canopies. If one fixture leaves crop edges dimmer, a harvest difference alone cannot isolate the red mix. Measure both at the planned settings. A crop trial can then examine the spectral choice without treating the shape of the red curve as a result.
At ANDYLED, we assess dual red in fixtures. Confirm expected benefit through a crop trial.
How Can You Compare Red-Light Fixtures Fairly?
Check the Spectral Power Distribution and Measurement Conditions
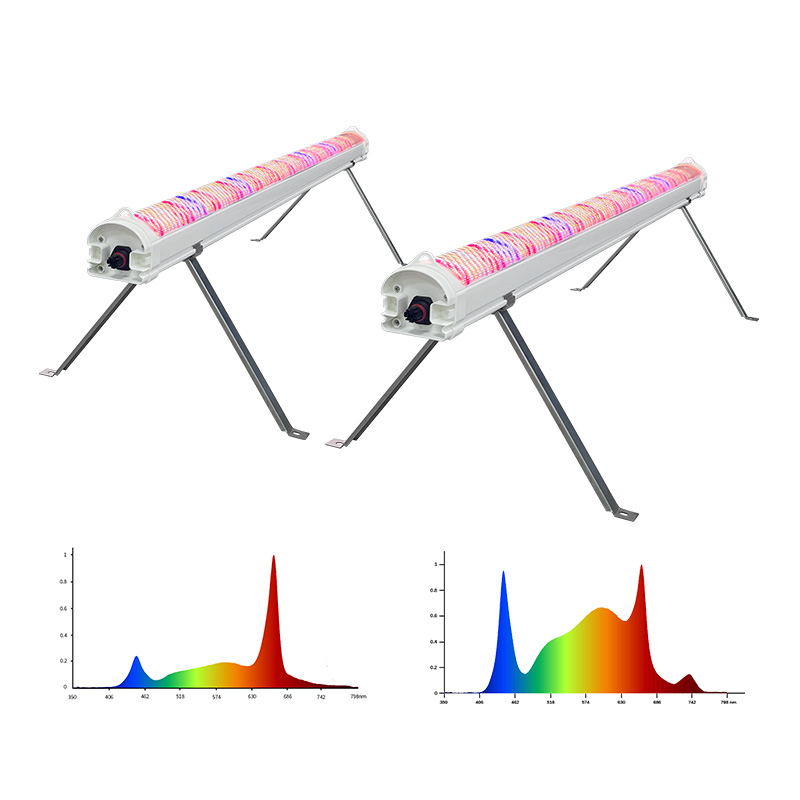
Check the vertical scale on SPD plots before reading their red peaks. A normalized chart can hide unequal absolute output. Record the units and which channels were active. With an adjustable fixture, request the curve at the planned setting. Blue, white, and the other channels should be read alongside red.
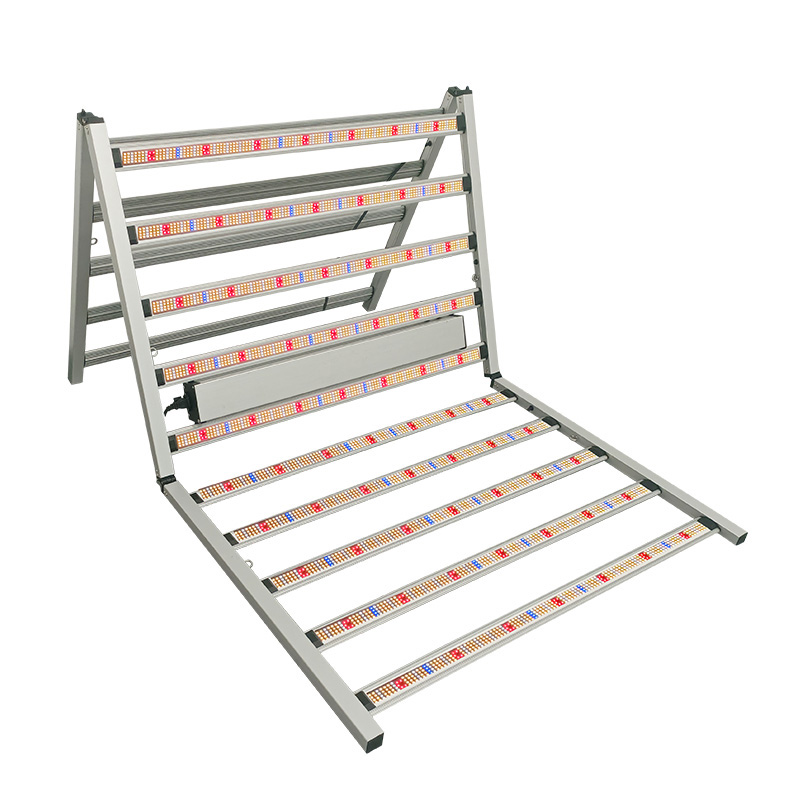
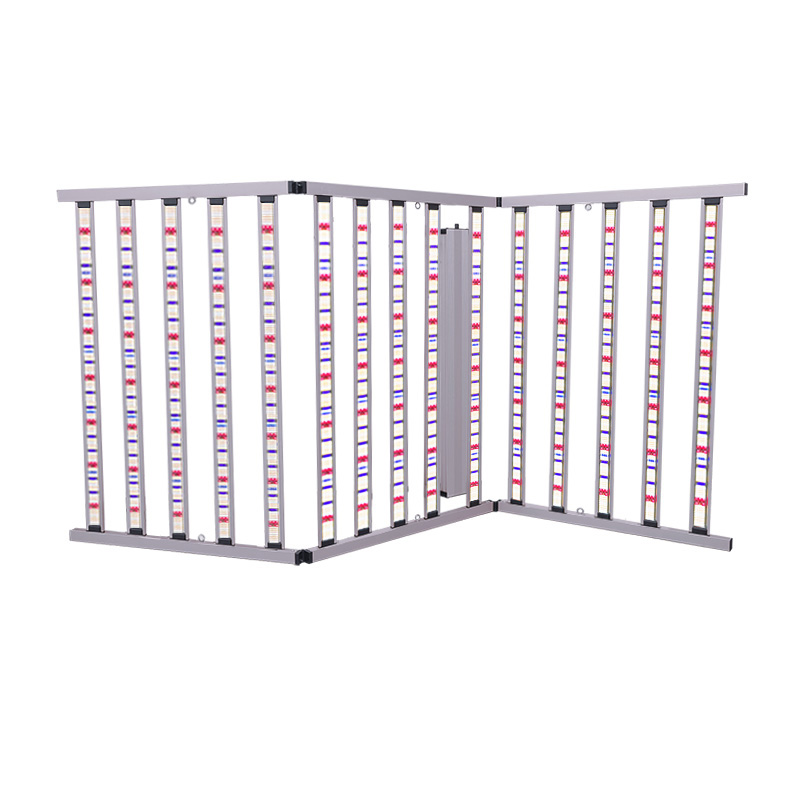
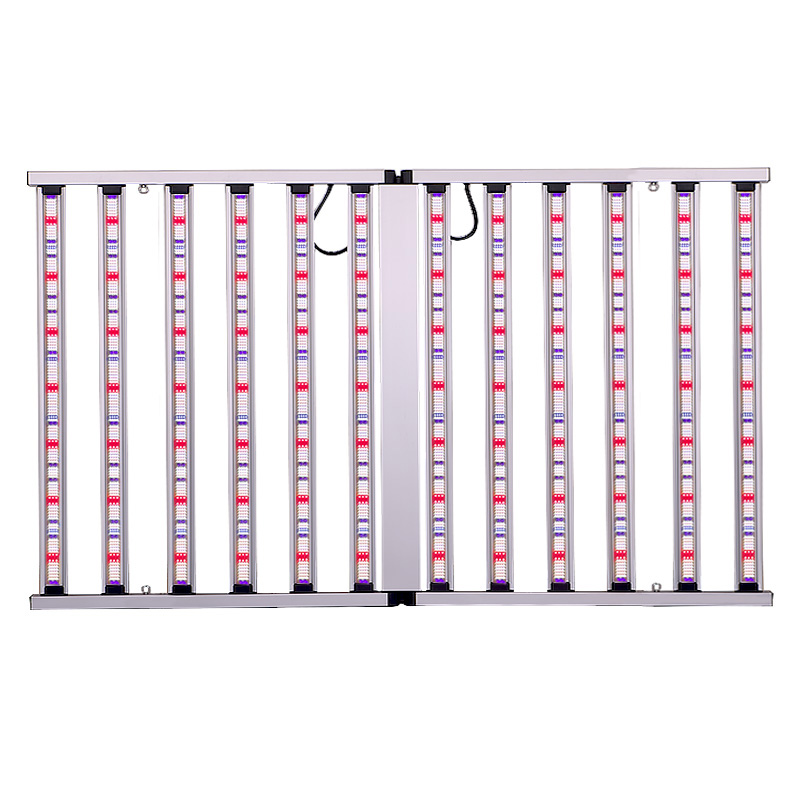
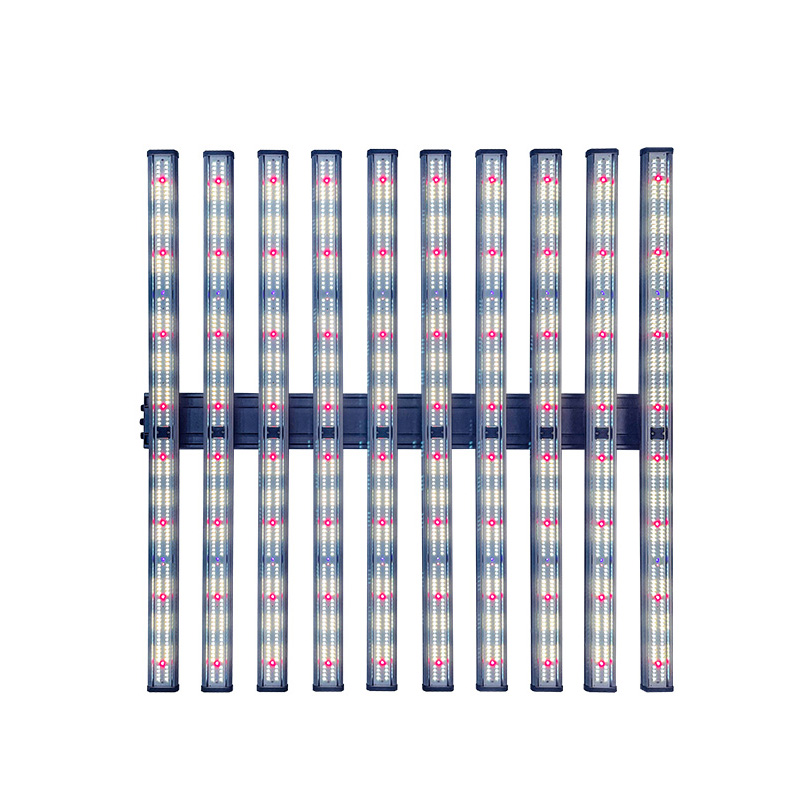
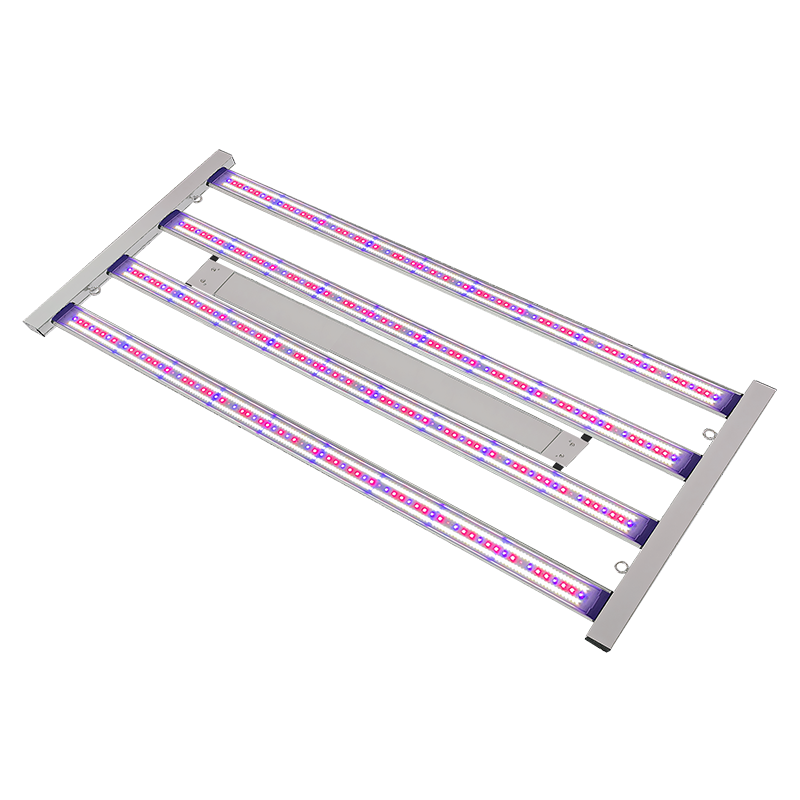
The 1000W 4 × 6 ft LED Grow Light (model AD10-1000-2C2-180) features a multi-channel spectrum comprising 3000 K and 6500 K white LEDs, 460 nm blue, 660 nm red, and 730 nm far-red light. Therefore, a comparison based solely on the red-light component would not accurately reflect its overall spectral characteristics. The current product listing confirms the presence of 660 nm red LEDs but provides no evidence of a 640 nm option. A complete spectral power distribution (SPD) should be requested from the manufacturer to verify the full spectrum and clarify whether 640 nm emission is included.

Compare PPFD Maps, Coverage, and Total Spectrum
A map matters most when the average looks acceptable: bright center readings can mask a weak perimeter. Read the planned-height corners at the intended dimming level before attributing crop growth to the red peak.
Run a Controlled Trial Before Changing a Whole Grow Room
A result cannot isolate red light if bays differ in cultivar, plant age, medium, irrigation, temperature, or photoperiod. Match conditions; archive each bay’s SPD and PPFD map with crop records. A strong result in one plant cannot speak for the group. If edge and center plants differ, inspect coverage and repeat before changing the room.
Decide whether the outcome is growth rate, uniformity, flowering timing, or marketable yield before results arrive. Track intensity, heat, spacing, and schedule throughout. If these conditions drift between bays, a spectral explanation becomes uncertain.
How Should Red Light Fit Into a Balanced Grow-Light Setup?
Balance Red With Blue, Green, and Broad-Spectrum Light
Red peaks cannot represent blue or broad-spectrum light. At the planned operating settings, compare those channels and canopy coverage. Green photons can reach lower leaves under some conditions. ANDYLED evaluates the channels as a system. Use the commercial LED grow-light range for the crop and footprint; compare complete SPDs.
Adjust Intensity and Daily Light Without Treating Wavelength as a Shortcut
An output increase after transplant should follow signs of recovery, including root development and stable leaf posture and color. Record canopy temperature and irrigation response before raising output. Then adjust gradually. If leaf posture changes, pause the increase. Recheck spectrum, PPFD, photoperiod, DLI, crop stage, and room conditions.
FAQ
Q: Is 640nm or 660nm red light better for plant growth?
A: Crop response under matched light decides. Match canopy PPFD. Then compare growth and harvest.
Q: Can plants grow with only 660nm red light?
A: Yes. 660 nm red supports photosynthesis. But inspect the remaining spectrum and canopy dose before choosing a red-only setup.
Q: Does 640nm red light increase plant yield?
A: A wavelength label cannot predict yield. Compare marketable yield across matched bays. Log PPFD through harvest. Track coverage, temperature, irrigation, and photoperiod.
Q: Should I use 640nm and 660nm red light together?
A: A dual-red SPD alone cannot justify the choice. Trial both at matched photon dose and judge the crop endpoint. The extra peak cannot show whether the cultivar will perform better through harvest under its planned growing conditions.
Q: How do I compare 640nm and 660nm grow lights?
A: Request SPD charts at planned settings and PPFD maps at mounting height. Compare center, corner, and crop results alongside peaks.


